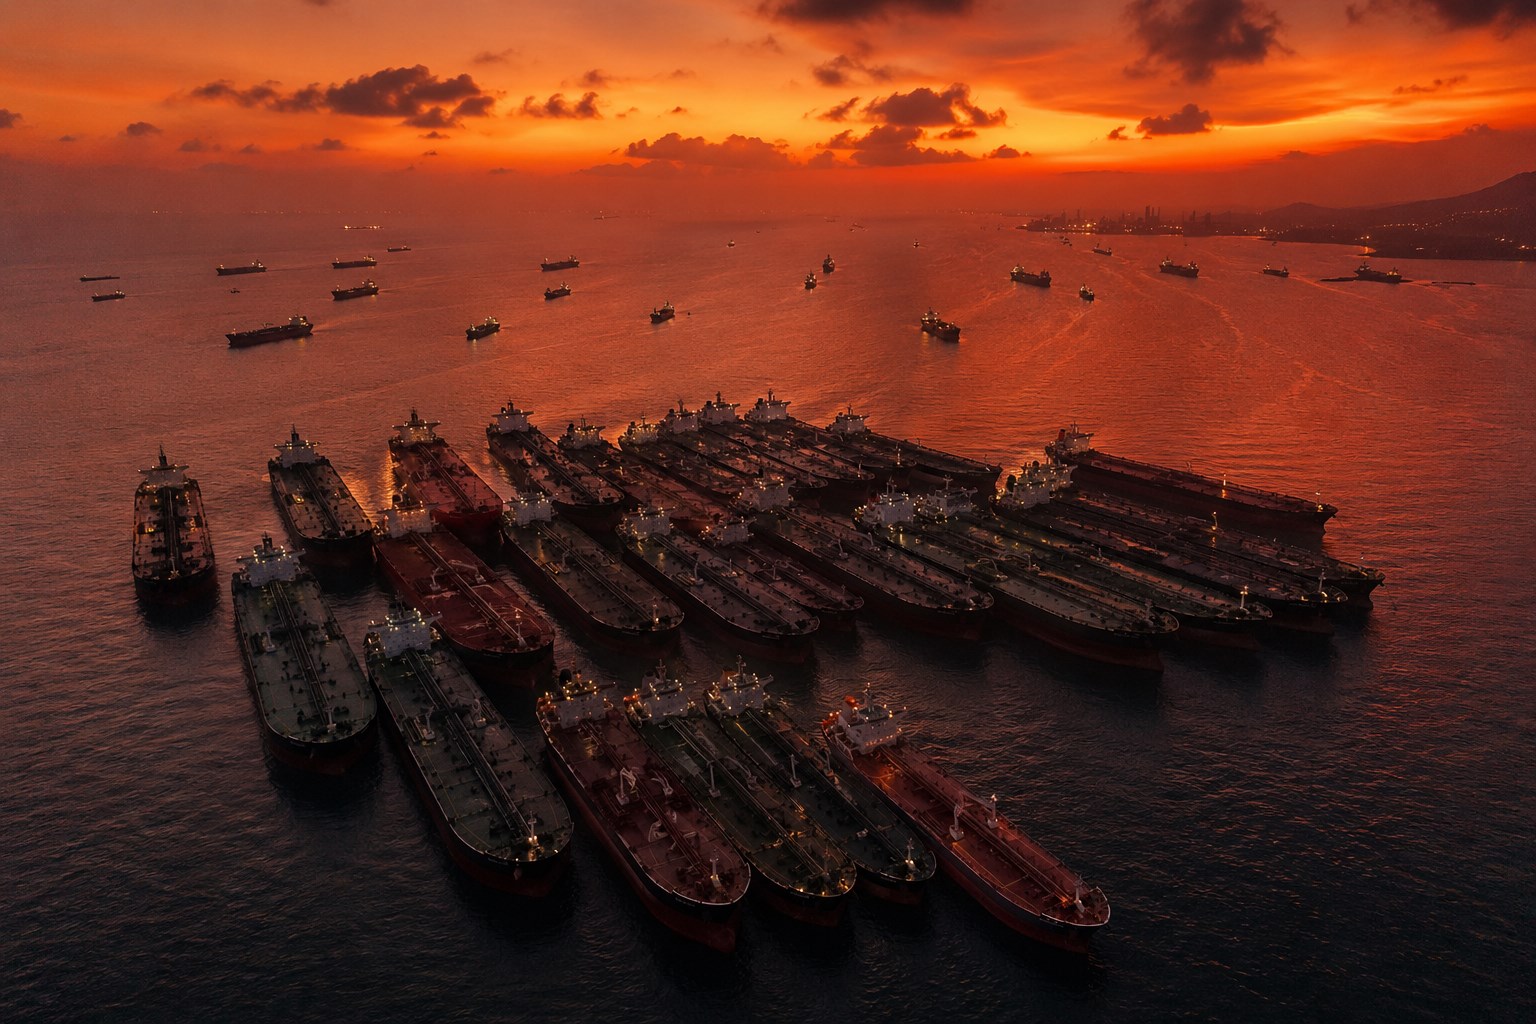
Brent crude has spent 2026 doing the same thing twice. It ran from the mid-$70s past $110 in the spring when the Strait of Hormuz closed, collapsed back below $70 by early July when a peace framework held, and then surged again above $86 in the middle of July as that framework broke and the United States and Iran returned to open conflict. As of mid-July, Brent trades near $86 a barrel, up more than 11% in a single week, its strongest run since April. This outlook is about where it goes from here.
The short version: Brent is caught between a glut that keeps pulling it down and a war that keeps yanking it back up. The rest of the year depends on which force wins, and the honest answer is that the single most important variable has not moved yet.
Why Brent, Not WTI, Carries the War Premium
Brent is the international benchmark, priced on waterborne crude with direct exposure to the sea lanes that carry Gulf oil to Europe and Asia. That is why it, rather than the US benchmark, absorbs most of the Middle East risk premium. Through the spring and again in July, the Brent-WTI spread widened well beyond its normal few dollars, because a threat to Hormuz hits Brent-priced barrels more directly than it hits US shale sitting inside the American pipeline network. When you want to read how much the market fears a supply disruption in the Gulf, Brent is the number to watch. For the domestic picture, see our WTI crude oil price outlook for 2026, and for the mechanics of the gap, WTI vs. Brent explained.
The Round Trip That Defined the Year
The spring crisis took Brent past $110 as the market priced the loss of a fifth of the world's seaborne oil. The June framework then erased the entire war premium in two weeks, and by early July Brent had returned to the low $70s, almost exactly where the year began. The July escalation started the cycle again: a US naval blockade of Iranian vessels, seven straight days of American strikes, Iranian retaliation across the Gulf, a drone hit on a tanker at Iraq's Basra terminal, and confirmed crude transit through Hormuz down about 62% to 4.1 million barrels a day.
The lesson from two round trips is that this premium is violent and reversible. It has repriced by $40 in each direction inside a month, twice. Anyone forecasting Brent for the rest of 2026 is really forecasting the probability of the next escalation and the next de-escalation, not a smooth trend line.
The Glut Underneath Is Real
Strip out the war and the physical market is oversupplied. OPEC+ has approved a fifth consecutive monthly production increase and is on pace to fully unwind its 2023-era voluntary cuts. Saudi Aramco cut its flagship Arab Light price to Asian buyers by the most in decades, a producer competing on price rather than defending it. US crude exports hit record levels during the spring scramble for non-Gulf supply, and American output is holding near record highs. The Energy Information Administration still models Brent averaging near $70 in the fourth quarter on a large expected build.
Demand gives the bears their second argument. China's factory activity has expanded only modestly, India's fuel demand slipped year-over-year in June, and US product inventories built through peak driving season. The IEA cut its 2026 demand growth forecast during the crisis. Morgan Stanley has projected Brent near $75 through the rest of the year with a possible surplus approaching 5 million barrels a day in 2027, and Citi has argued crude could sink toward $60 as Hormuz flows normalize. That surplus is the gravity under every rally.
The Tail Risk Is a Single Island
Here is why the premium has not run further even now. Every escalation of the July crisis, the blockade, the strikes, the tanker hits, the Red Sea threats, has raised the cost and danger of moving oil without removing a single barrel at the source. Kharg Island, the terminal that handles roughly 90% of Iran's crude exports, has not been hit. The gap between today's $86 and the war highs above $110 is, almost entirely, Kharg.
That makes the forecast unusually binary. Goldman Sachs says that if Hormuz stays largely shut for another month, Brent averages above $100 through the rest of 2026, with a path toward $125 this quarter. JPMorgan holds a base case near $86 this quarter easing to $80. The distance between those two numbers is one strike, or one ceasefire.
The Range for the Rest of 2026
The base case is a wide, nervous band. Absent a strike on Iranian export infrastructure, Brent spends the second half in a mid-$70s to low-$90s range, with the war premium and the glut fighting to a draw: escalation headlines push it toward $90, and every lull lets OPEC+ supply and soft demand pull it back toward the $70s. The current news is the best guide to which way the next week leans.
The two tails are genuine and roughly symmetric. To the upside, a hit on Kharg or a lasting closure of Hormuz sends Brent through $100 and toward Goldman's $125 scenario within days, into a market carrying almost no cushion. To the downside, a durable ceasefire drops the premium into a glut that is waiting to take prices back toward $70 or below, the Citi case. Both are live. What is not likely is the thing forecasters usually assume, a quiet drift, because 2026 has offered no quiet.
For readers tracking it day to day, the live Brent price and oil prices today pages carry the current number. The forecast here is a map of the terrain, not a prediction of the weather. This year, the weather has changed twice a month.
Disclaimer: This analysis is for informational purposes only and does not constitute financial or investment advice. Oil markets are volatile and past performance is not indicative of future results.