Scroll the graphic sideways to read it, or open the full-size SVG.
The six traps, in detail
1. The contract roll
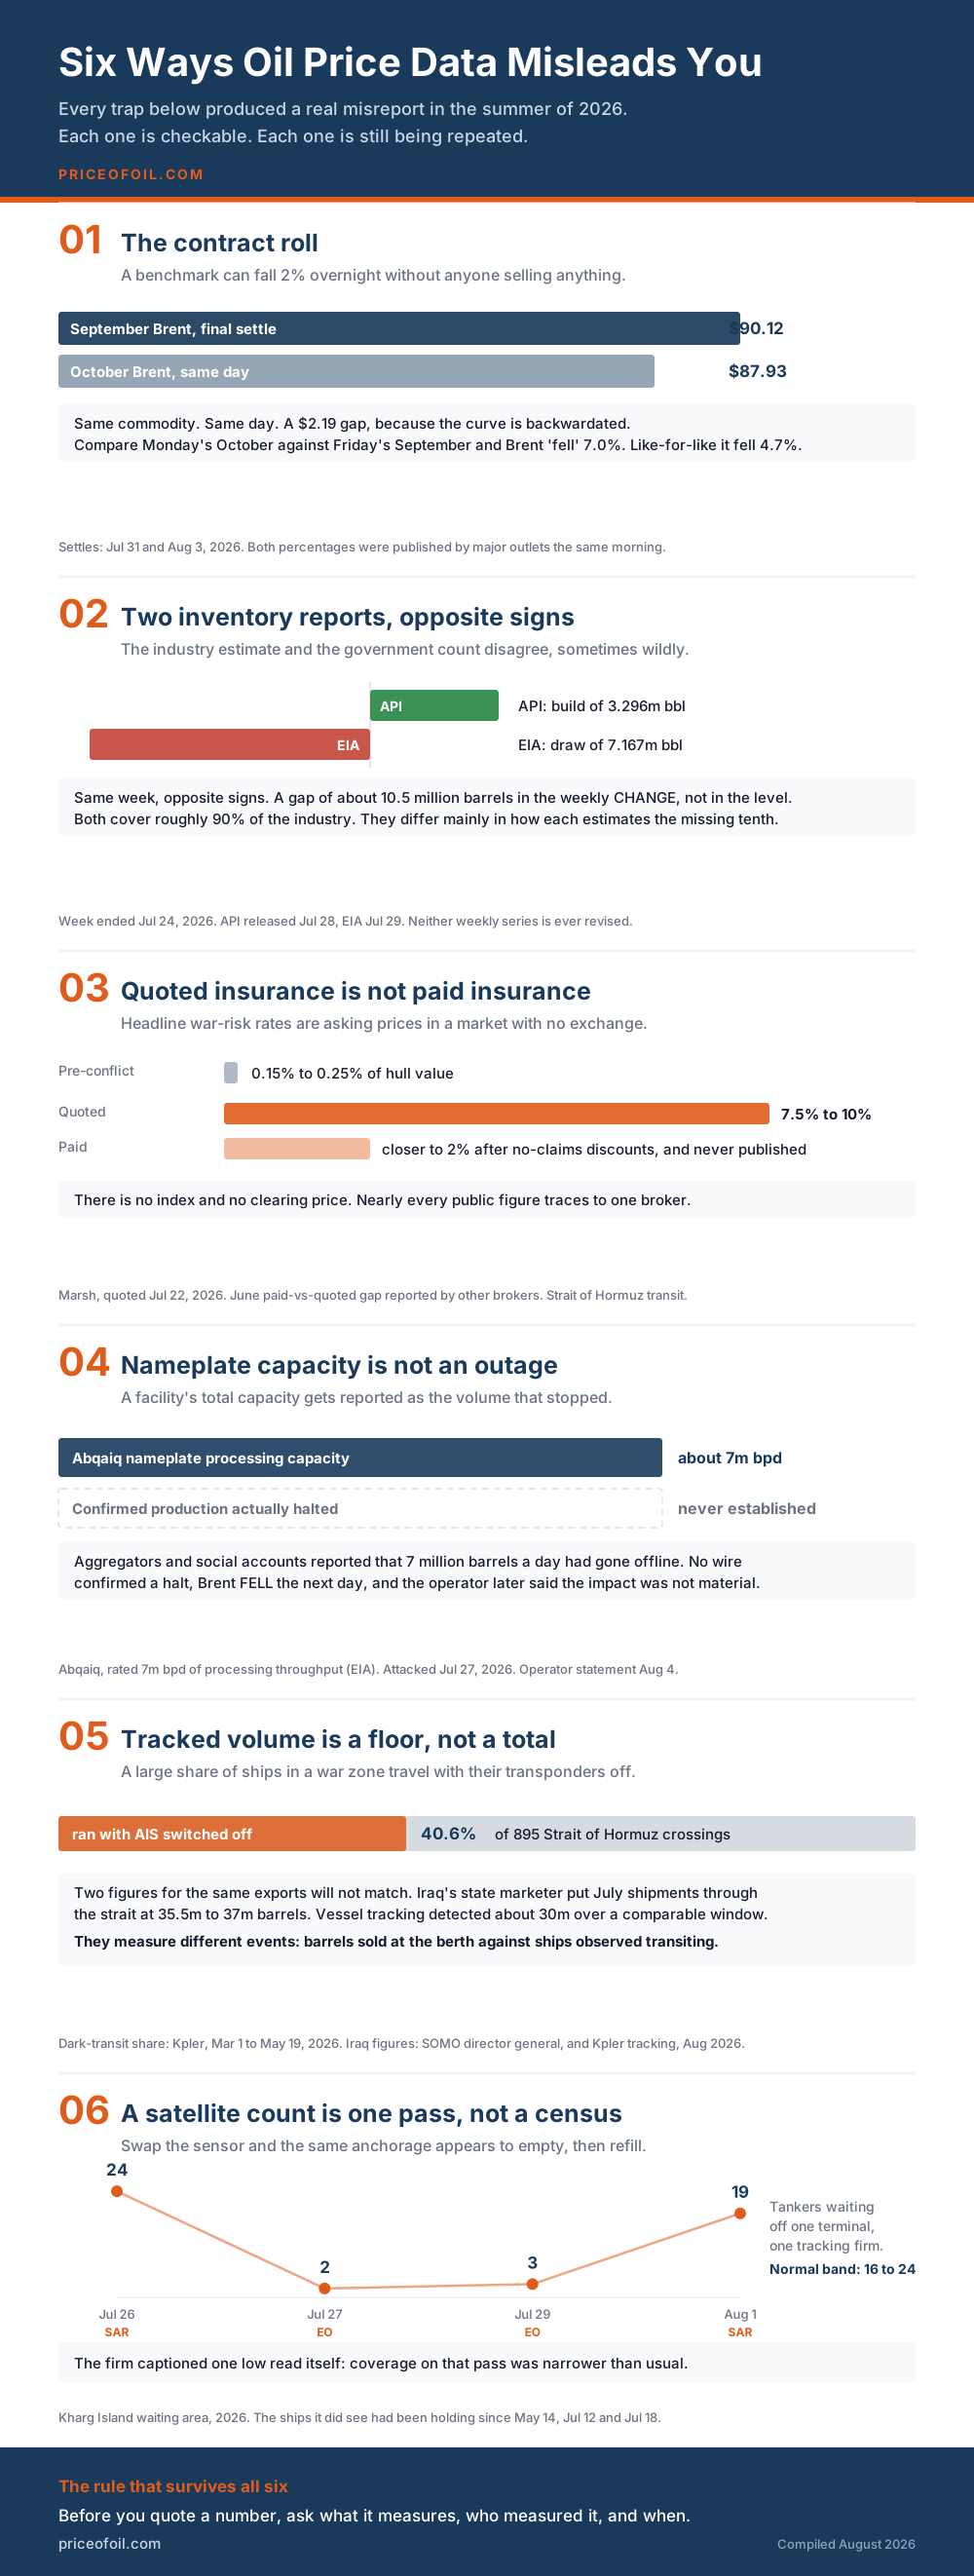
Oil futures expire monthly. When the front-month contract rolls, the quoted benchmark switches to a different contract that was already trading at a different price. In a backwardated market, where nearer barrels cost more than later ones, the new front month sits below the old one.
On 31 July 2026 the September Brent contract expired at $90.12 while October settled at $87.93, a gap of $2.19 for the same commodity on the same day. When October settled at $83.77 on 3 August, comparing it against September's final settle produced a fall of 7.0%. Comparing October against October produced 4.7%. Both figures were published that morning. Roughly 2.3 percentage points of the reported drop was a calendar change.
2. Two inventory reports, opposite signs
The American Petroleum Institute publishes a crude inventory estimate on Tuesday evenings. The Energy Information Administration publishes the official count on Wednesday mornings. The common description of these as voluntary versus mandatory data is misleading: the API largely receives voluntary copies of the same filings companies are legally compelled to send the EIA. Both cover roughly 90% of the industry, and they differ mainly in how each estimates the missing tenth.
For the week ended 24 July 2026 the API reported a build of about 3.296 million barrels and the EIA a draw of 7.167 million. That is a gap of roughly 10.5 million barrels in the weekly change, not in the stock level, and it runs well outside the band the API itself advertises. Treating Tuesday's number as a preview of Wednesday's is a mistake in any week and was a large one in that week. Neither weekly series is ever revised, so nobody has established which was closer.
3. Quoted insurance is not paid insurance
Marine war-risk cover has no exchange, no index and no published clearing price. Rates circulate as a percentage of a ship's insured hull value, and almost every public figure traces back to a single broker.
Quoted rates for a Strait of Hormuz transit reached 7.5% to 10% of hull value in late July 2026, against a pre-conflict baseline nearer 0.15% to 0.25%. What owners actually pay is lower, because large no-claims discounts are negotiated case by case, and it is not published. Two ships crossing on the same day can be quoted very differently depending on flag, ownership chain, charterer and recent port calls.
4. Nameplate capacity is not an outage
Processing and refining facilities are described by their nameplate capacity, the volume they can handle when running fully. That figure is a property of the plant, not a measurement of anything that happened to it.
Abqaiq is rated at about 7 million barrels a day of processing throughput. After the drone attack of 27 July 2026, aggregators and social accounts reported that Aramco had halted the plant, removing 7 million barrels a day. That figure was the plant's nameplate capacity, not a measured outage. No wire service confirmed a halt, Brent fell the following day, which is not how a market behaves when 7% of global supply disappears, and on 4 August the company said the attacks had no material operational or financial impact. The capacity figure had simply been relabelled.
5. Tracked volume is not actual volume
Vessel-tracking firms infer cargo movements from transponder signals. Ships operating under sanctions, or in a war zone, routinely switch those transponders off. Kpler found that 40.6% of Strait of Hormuz crossings, 364 of 895, ran with AIS switched off between 1 March and 19 May 2026. Tracked volume is a floor, not a total.
The director general of Iraq's state marketer put July exports through the strait at 35.5 to 37 million barrels. Kpler's tracking detected about 30 million over a comparable window. Neither figure is dishonest, and the gap is not evidence of anything on its own: the two measure different events, barrels sold at the berth against ships observed transiting, and the windows are offset by several days. Attributing a specific gap like this to dark shipping is exactly the kind of inference this page is about.
6. A satellite count is one pass, not a census
Satellite imagery comes from different sensors on passes of varying width. Synthetic aperture radar and electro-optical imaging do not see the same scene, and a count from a narrow pass is not comparable with one from a wide pass. The difference looks exactly like ships arriving or leaving.
Counts of tankers waiting off Kharg Island ran 24, then 2, then 3, then 19 across seven days in 2026, from the same tracking firm. The two high readings came from radar passes at an identical collection time; the two low ones came from electro-optical passes. The firm captioned one of the lows itself, noting that coverage on that pass was narrower than usual. Its own stated normal band for that anchorage is 16 to 24, the individual ships it did see had been holding since 14 May, 12 July and 18 July, and its later posts quietly resumed the series without ever reconciling the 2 or the 3.
The rule that survives all six
Before quoting a number, ask three questions. What does it measure? Who measured it? When? Most bad oil reporting fails on one of those, and the failure is usually visible in the source itself.